 ®
®
01
Connect technical signals with the case
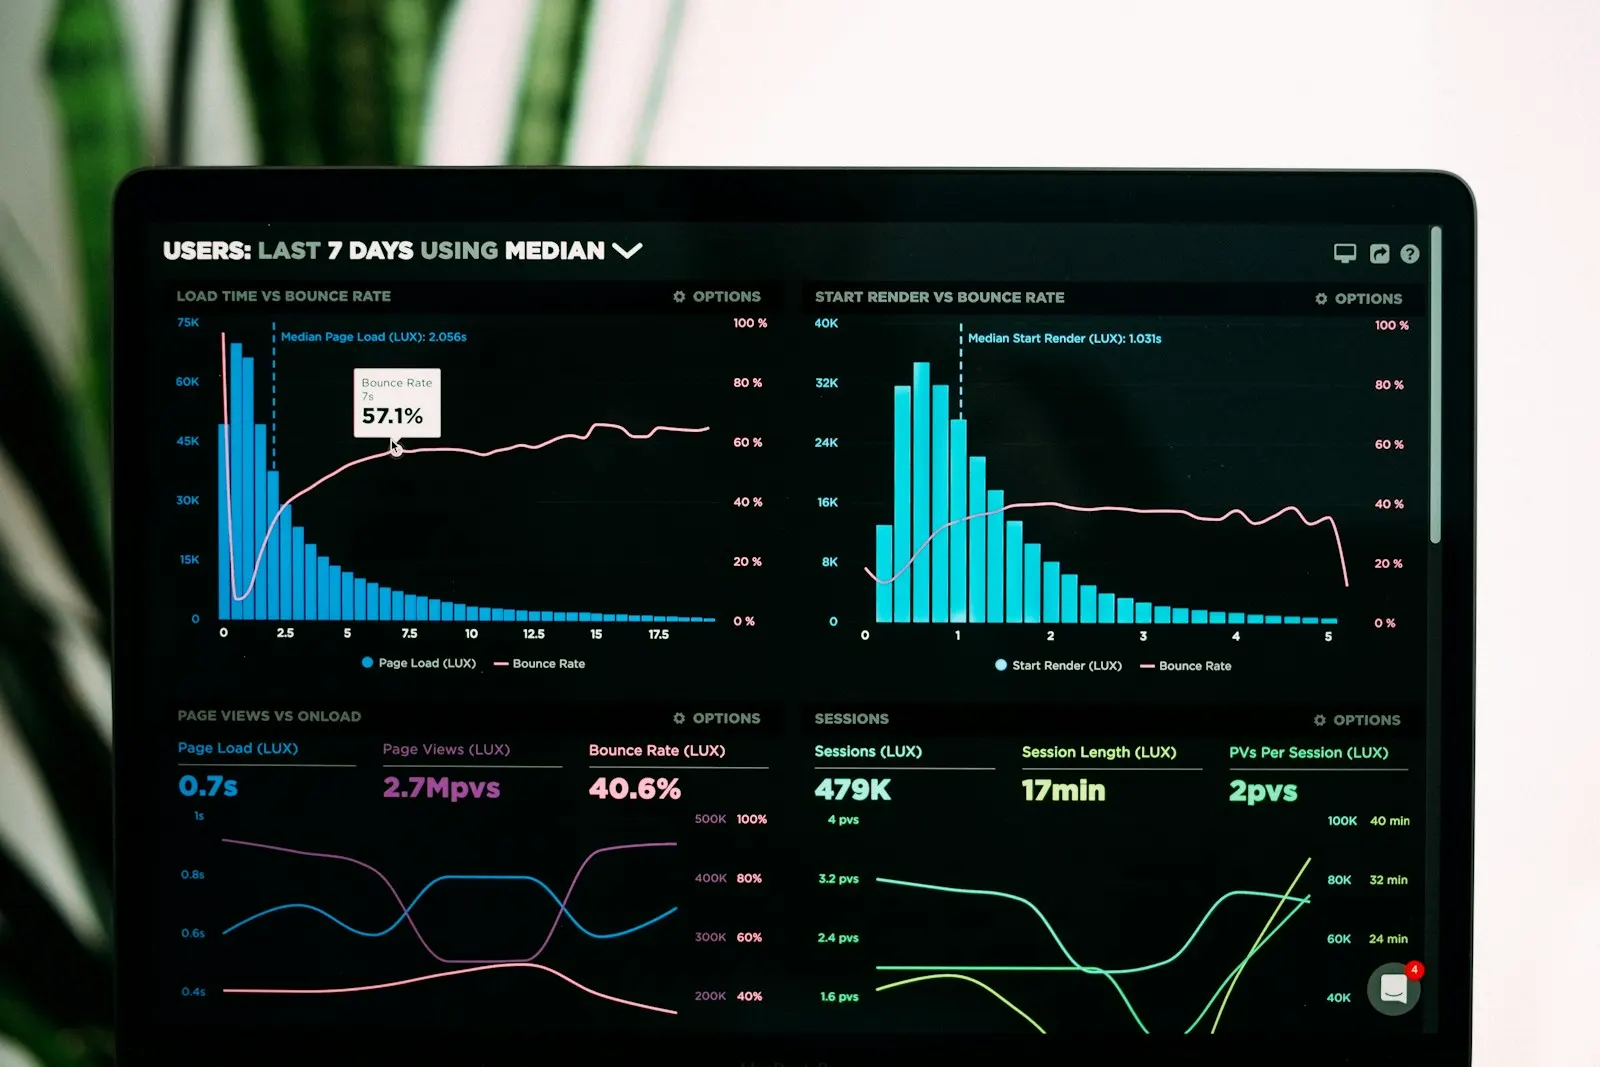
Traces can show the path of a request across services, metrics can show changes in operation and logs can show individual events. We plan suitable correlation identifiers and limit sensitive content. A dashboard answers concrete questions: where is the order waiting, which counterpart is responding slowly and which messages need to be clarified? Sampling and retention are chosen so that diagnostic value, data protection and cost fit together. Not every debug output belongs permanently in production.